コアレポートのリファレンス
コアレポートは、ビデオ(プロジェクト)ごと、または視聴者ごとに集約されたインタラクション データを表示する一連のレポートです。どのビデオが最も魅力的か、どの視聴者が最も関与しているかを示します。
以下のインタラクティビティ レポートも利用可能です:
コア レポートを表示するには、Analytics モジュールを開き、左側のナビゲーションで インタラクティブ機能 > コアレポート リンクをクリックします。
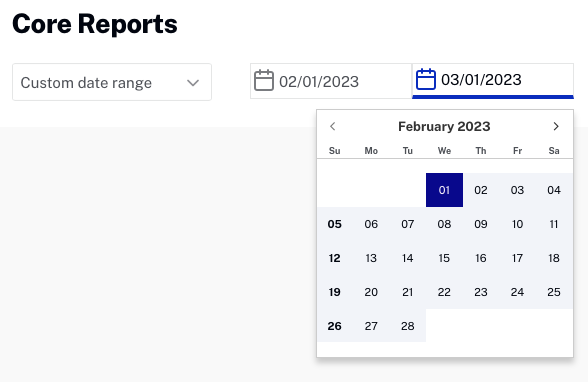
日付セレクターを使用してレポートの期間を指定できます。固定日付範囲を選択するか、カスタム日付範囲を選択してください。
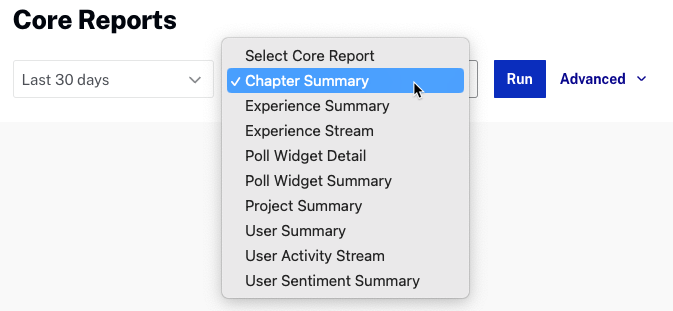
をクリックしてレポートを実行します。詳細設定 をクリックすると、プロジェクトまたはエクスペリエンスIDでレポート結果をフィルタリングできます。単一のIDまたはカンマ区切りリストをサポートします。
すべてのレポートでは、 をクリックしてレポートデータをダウンロードする機能を提供しています。
これらの各レポートの概要は、以下のセクションで説明されています。
チャプターの要約
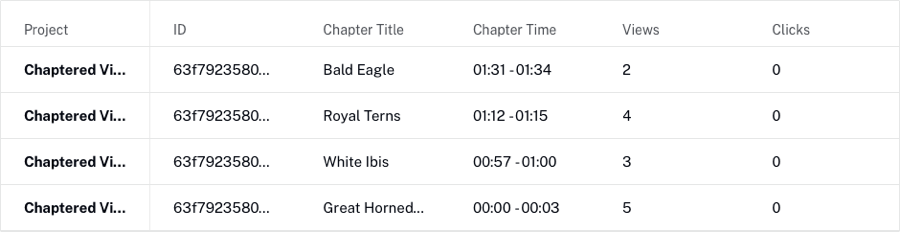
チャプター要約レポートは、チャプターを持つすべてのプロジェクトを表示します。このレポートには以下が表示されます:
- プロジェクト - プロジェクト タイトル
- ID - プロジェクトID
- チャプタータイトル - チャプタータイトル
- チャプター時間 - チャプター開始時間
- 視聴時間 - その部分のビデオが再生された回数(通常再生中にチャプターマーカーを通過した回数)
- クリック - チャプターメニューでチャプター名がクリックされた回数
エクスペリエンスの要約
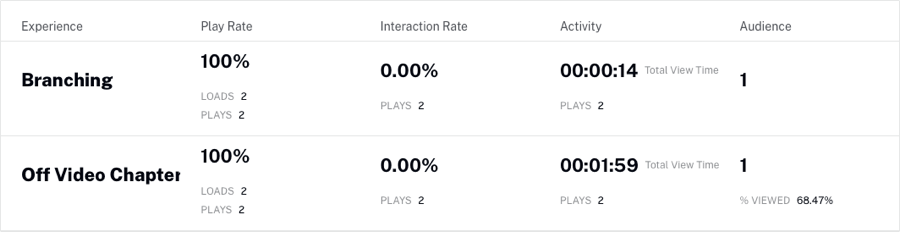
エクスペリエンスの要約レポートは、各エクスペリエンスごとに1行で表示され、視聴者のビデオへの関与を示します。このレポートでは以下が表示されます:
- エクスペリエンス名 - エクスペリエンスの名前
- 再生率 - エクスペリエンスが読み込まれて再生可能な状態になった回数に対する再生回数の割合
- インタラクション率 - インタラクションを伴う再生回数を、全再生回数(インタラクションがない可能性も含む)で割った割合。インタラクションには、再生ボタンや音量などではなく、インタラクティブな要素の使用(または時間経過による自動的なアクション)が含まれます。
- 合計視聴時間 - 全ユーザーにおける総視聴時間(例:全体でビデオがどれだけ視聴されたか)。ビデオのどの部分が視聴されたかは区別しません。
- 視聴者数 - 自動生成されたランダムなもの、または明示的に提供されたユーザーIDトークンに基づいて判別されるユニーク視聴者数。
エクスペリエンス ストリーム
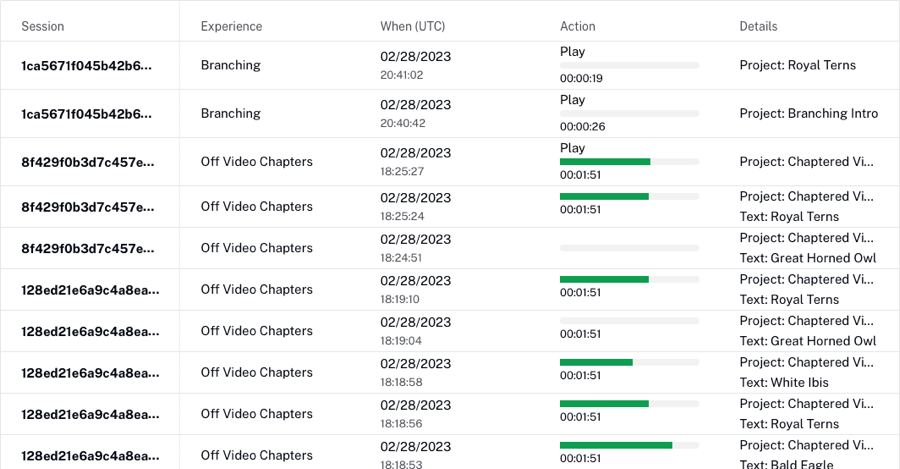
エクスペリエンス ストリームレポートは、各アクションごとに1行で表示されます。このレポートには、ブックマークの表示、プレーヤーコントロールとのユーザーインタラクション、注釈やウィジェットが含まれます。進行イベントは除外されます。このレポートでは以下が表示されます:
- セッション - セッションID
- エクスペリエンス - エクスペリエンスのタイトル
- いつ - いつアクションが発生したか
- アクション - 発生したアクション
- 詳細 - 操作されたプロジェクトや注釈
投票ウィジェットの詳細
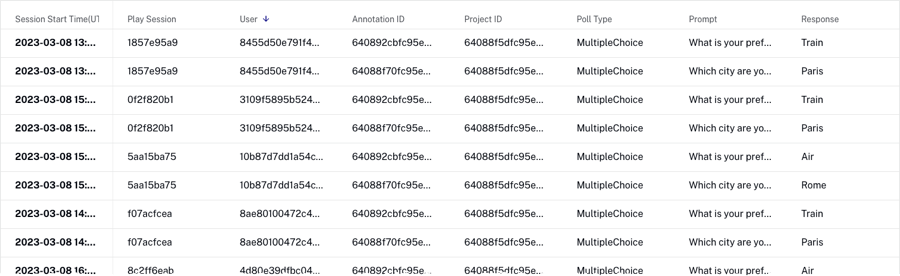
投票ウィジェットの詳細レポートは、各投票送信イベントごとに1行で表示されます。このレポートでは以下が表示されます:
- セッション開始時刻 - セッションの日付と時刻(UTC時間)
- 再生セッション - 再生セッション
- ユーザー - Brightcove Interactivity によって割り当てられるランダムなユーザーID。このIDは、ユーザーがインタラクティブ コンテンツに初めてアクセスした際に割り当てられます。有効期限は1年間です。
- 注釈ID - 注釈ID
- プロジェクトID - プロジェクトID
- 投票タイプ - 投票の種類
- 質問 - 投票で尋ねられた質問
- 回答 - 投票への回答
投票ウィジェットの要約
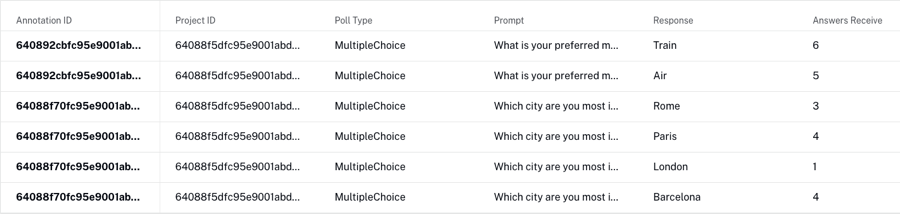
投票ウィジェットの要約レポートは、各投票ウィジェットの回答値ごとに1行ずつ表示され、回答数が含まれます。プロジェクトID 列には、投票が表示され、送信されたすべてのプロジェクトの一覧が含まれます。同じ投票ウィジェットが複数のプロジェクトで使用されるテンプレートをサポートするために、この情報が含まれています。このリストは重複除外されていません。このレポートには以下が表示されます:
- 注釈ID - 注釈ID
- プロジェクトID - プロジェクトID
- 投票タイプ - 投票の種類
- プロンプト - 投票で出された質問
- 応答 - 投票の回答
- 回答を受領 - 回答を選択したユーザー数
プロジェクトの要約
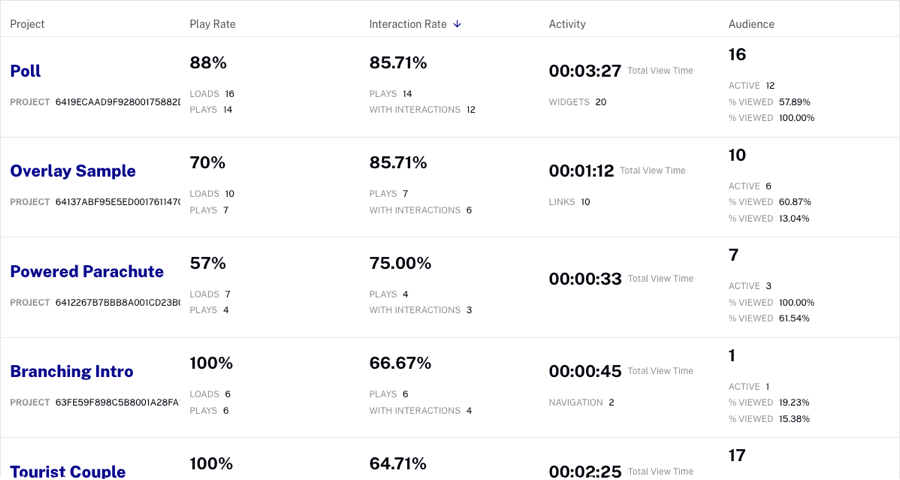
プロジェクトの要約レポートは、各プロジェクトについて全ユーザーの集計パフォーマンスデータを表示します。レポートの各行は個別のプロジェクトを表します。このレポートには以下が表示されます:
- プロジェクト - プロジェクトのタイトルとID
- 再生率 - 再生回数を、ロードされ再生可能状態になった回数で割った値
- インタラクション率 - インタラクションを伴う再生回数を再生回数で割った値
- 合計視聴時間 - 全視聴者の総視聴時間
- 視聴者 - アクティブな視聴者(インタラクティブ要素をクリックした視聴者)とパッシブな視聴者(クリックしなかった視聴者)の人数。各セグメントのメディア視聴率(%)は、パッシブ視聴者についてはロードしただけで再生しなかった人を除外して計算します。
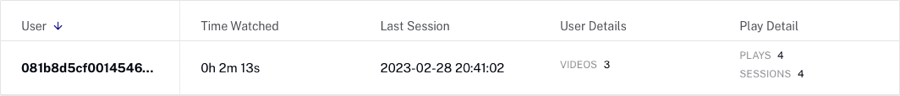
ユーザーの要約
ユーザーの要約レポートは、各ユーザーが視聴した各プロジェクトにおける全体的な行動を集計したものです。このレポートには以下が表示されます:
- ユーザー - Brightcove Interactivity によって割り当てられるランダムなユーザーID。このIDは、ユーザーがインタラクティブコンテンツに初めてアクセスした際に割り当てられます。トークンは1年間有効です。
- 視聴時間 - すべての動画の総視聴時間
- 直前のセッション - 最終セッションの日時(UTC時間)
- ユーザーの詳細 - 各機能が使用された回数
- リンク - テキスト、画像、透過オーバーレイ
- ナビゲーション - チャプターや時間ジャンプ機能を持つオーバーレイ
- 回答 - クイズ
- ウィジェット - 標準ウィジェット
- 動画 - 再生されたユニークな動画数
- 再生の詳細
- 再生 - 動画の再生回数
- セッション - 動画がロードされ再生可能状態になった回数(再生は必ずしも行われているわけではない)
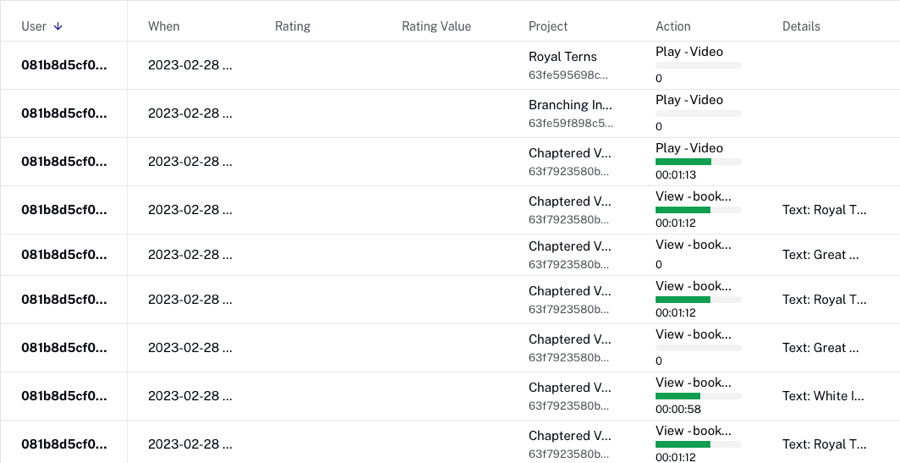
ユーザー アクティビティ ストリーム
ユーザー アクティビティ ストリーム レポートは、プロジェクト内で視聴者が行った各アクションをイベントごとに詳細に示します。たとえば、ブックマークをクリックした際、リンクをクリックした際、クイズに回答した際、動画を終了した際など、これらすべてのイベントがこのレポートに記録されます。ただし、進捗イベントは除外されます。このレポートには以下が表示されます:
- ユーザー - Brightcove Interactivity によって割り当てられるランダムなユーザーID。初めてインタラクティブ コンテンツにアクセスしたときに割り当てられます。トークンは1年間有効です。
- いつ - アクションが発生した日時(UTC時刻)
- 評価 - ユーザー感情ウィジェットによる評価アイコン(良い、悪い)
- 評価値 - 使用されたアイコンの種類に関係なく、ユーザー感情ウィジェットからの評価値(1, 3, 5)
- プロジェクト - 対象となったプロジェクトのタイトルとID
- アクション - 実行された特定のアクションの一覧(例:動画の再生イベント、リンクのクリック、クイズの回答、チャプターマーカーのクリック)および動画内のアクション発生時間。動画イベント:
- 最終 - 動画 - 視聴を停止(動画放棄、ブラウザタブを閉じる、または再生中にブラウザを閉じる)
- 動画終了未満 - 動画の終了時に到達したが、動画の総長未満を視聴(先送りまたは分岐)
- 動画終了超過 - 動画の総時間を超えて視聴(巻き戻し、ループ)
- 動画終了完了 - 最初から最後まで全て視聴
- 詳細 - 注釈の追加情報を提供(例: クリックされたブックマークのテキスト、開かれた外部URL、カスタムコード、質問のテキストと記録された回答)
- 注釈ID - アクションが発生した注釈のID
ユーザー感情の要約
ユーザー感情の要約レポートは、ユーザー サマリー ウィジェットの結果を示します。このレポートには以下が表示されます:
- プロジェクト - プロジェクト名
- プロジェクトID - プロジェクトID
- 動画ソースID - 動画ID
- 評価付き再生数 - 評価が与えられた再生数
- 評価の中央値 - 評価の中央値
- 最高評価の再生 - 最大評価が与えられた再生数
- 最低評価の再生 - 最小評価が与えられた再生数
